From 1997 to 2014, I managed the website development firm Summersault LLC. I co-founded the company with fellow Earlham College student Mark Stosberg and we were primarily based in Richmond, Indiana. Our mission was "to build and sustain communities using the technologies of the Internet."
![]()
Summersault offered a range of services related to website development, including graphic design, Perl software development, WordPress and Drupal site development, HTML and CSS build-out, search engine optimization, online commerce, social media integration, custom web application development, web hosting, site maintenance and more. We also performed consulting and training services around topics like information architecture for the web, online security and privacy, social media best practices, maintaining WordPress and Drupal sites and more.
Our clients were an eclectic mix of businesses, not-for-profit organizations and creative individuals all over the United States. We were also proud to sponsor and support a number of local community organizations and regional improvement efforts along the way.
I've written a fair amount on this site and elsewhere about my adventures in small business ownership and management. A few posts that might be of particular interest:
- Summersault by the numbers
- Summersault update
- How I learned to run a business
- On moving to a new, larger office space
- 5 business values I learned via Earlham College
- Summersault's history with business incubation
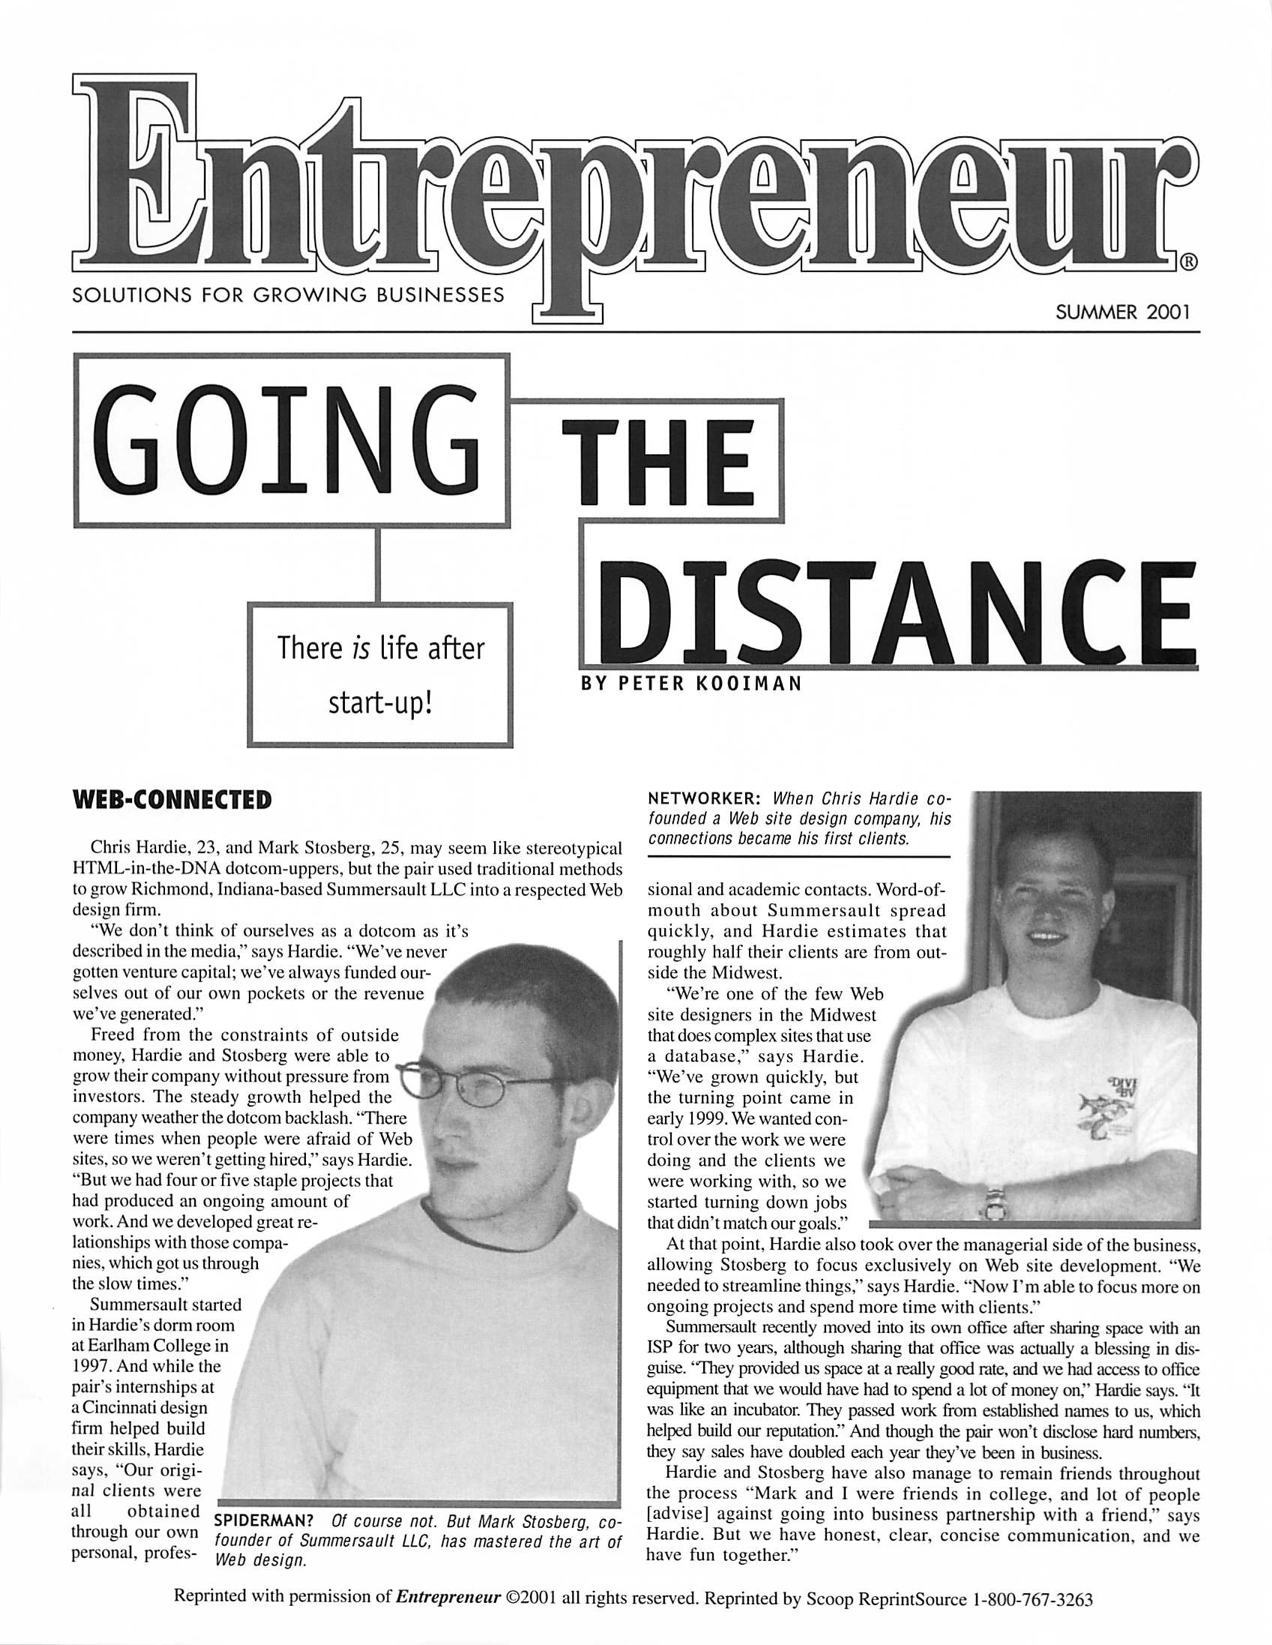
Here's a reprint of an article in Entrepreneur magazine that featured Summersault early on (click for full size):
I'm thankful for all of the people who were involved in Summersault's existence at one point or another: coworkers, clients, vendors, community supporters and the friends and family who cheered us on. I had the time of my life.